Energy Infrastructure Risk Intelligence: Reading Pipelines, Ports and Grids Before the Price Moves
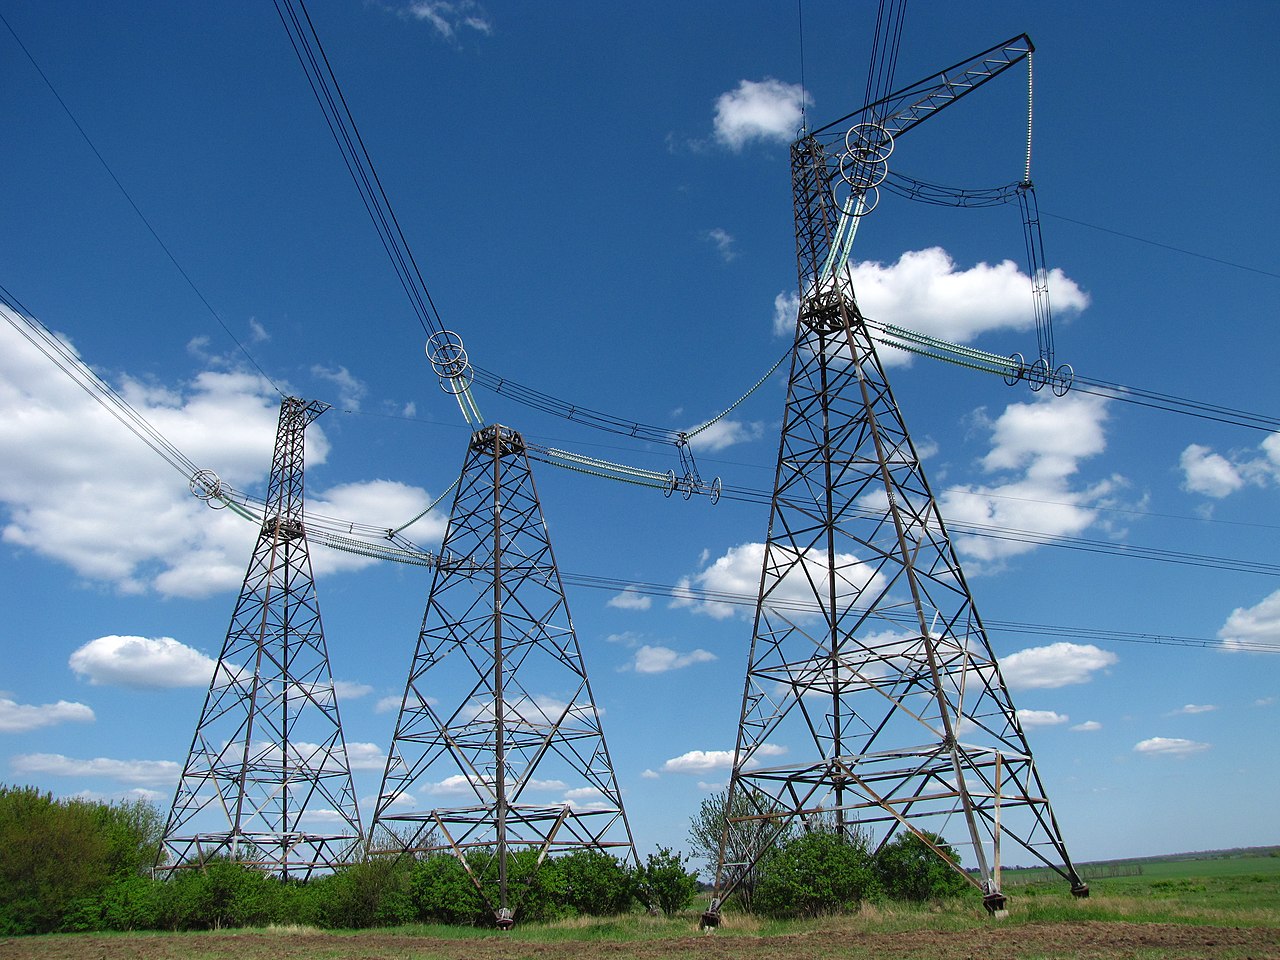
High-voltage transmission line. Photo: Novoklimov / Wikimedia Commons, CC0.
Most energy price shocks do not begin on a trading screen. They begin at a compressor station that trips offline, a terminal that loses berth capacity, a substation that fails during a heatwave, or a strait where tanker traffic quietly slows. By the time the move shows up in a futures contract, the physical story is usually hours or days old. That gap is exactly what energy infrastructure risk intelligence is meant to close, and it is the reason GeoMoney Intelligence Platform built its energy infrastructure risk intelligence desk around physical assets rather than headlines.
This post looks at what infrastructure risk actually means for analysts and investors, which signals deserve attention, and how to build a routine that turns scattered asset data into an early view of supply stress.
Why Physical Infrastructure Is the First Place Risk Appears
Energy markets are priced on expectations, but they are settled in molecules and megawatts. Every barrel, cargo and electron has to move through a chain of extraction, processing, transport, storage and distribution. Each link in that chain has a finite capacity, and when one link is impaired, the effect travels downstream.
Consider three common patterns:
- Transport bottlenecks. A pipeline outage or a port restriction does not reduce global supply on paper, yet it strands volumes in one region and starves another. Regional price spreads widen long before the benchmark reacts.
- Storage constraints. When tanks or caverns approach their limits, sellers lose flexibility. Contango, backwardation and storage economics shift quickly.
- Grid stress. Power systems under heat, cold or fuel shortages pull harder on gas and coal, which feeds straight back into fuel markets.
None of these is visible in a quarterly report. They are visible in asset status, route congestion and operating conditions, which is why infrastructure has to be monitored directly.
The Signals That Matter Most
A useful infrastructure risk view does not try to track everything. It focuses on the assets and corridors where a disruption would actually change flows. In practice that means a short list:
Chokepoints and corridors. Straits, canals and major pipeline routes carry a disproportionate share of traded energy. A slowdown at one of them is a higher-impact event than a dozen outages at smaller facilities.
Processing hubs. Refineries, LNG liquefaction trains and gas processing plants convert raw supply into tradeable product. An unplanned outage here changes product cracks and regional balances.
Storage and terminals. Import and export terminals are where physical supply meets the seaborne market. Berth availability, loading delays and inventory levels at these points shape prompt pricing.
Grid nodes. Interconnectors and high-load substations reveal where power demand is outrunning supply, often a leading indicator for fuel demand.
The aim is to see these signals together, on one map, so that a single event can be judged against the rest of the system. A tanker delay means little on its own; the same delay alongside a refinery outage and a cold snap tells a very different story.
From Raw Data to an Operating Picture
The practical challenge is not finding data. It is combining it. Asset registers, vessel feeds, weather data and grid observations usually live in separate tools, each with its own format and refresh cycle. Analysts end up copying figures between spreadsheets and losing the context that makes the numbers meaningful.
The GeoMoney approach is to put reference infrastructure, provider observations and planning simulations into one workspace. The Energy Infrastructure Command Desk combines a unified 2D and 3D map, an asset inspector, supply and demand views, a threat radar and market trend panels. Each facility marker can be inspected, and outage scenarios can be simulated to estimate how an impairment would ripple through connected assets and trade flows. Simulations are clearly labelled as illustrative, which matters: a scenario is a planning tool, not a forecast.
That separation between observed data and modelled assumptions is something every analyst should insist on. A good operating picture tells you what is known, what is estimated and what is a "what if".
Readers who want to go deeper into the hydrocarbon side of this picture can see how a dashboard for oil and gas intelligence layers tanker movement, refinery activity and corridor volatility on top of the same asset base.
Building a Daily Infrastructure Risk Routine
Tools only help if they are used consistently. A simple routine for a morning review might look like this:
- Scan the chokepoints first. Check vessel density and any reported slowdowns on the major straits and canals. Note anything outside its normal range.
- Review asset status changes. Look for new outages, restarts or maintenance at processing hubs and terminals in the regions you trade or cover.
- Check weather against the grid. Heat, cold and storms are the most common triggers for sudden power and gas demand.
- Run one scenario. Pick the most plausible disruption of the day and simulate it. Ask which regional prices and spreads would move first.
- Write down the thesis. One or two lines on what you expect and why, so you can test your judgement against what actually happens.
The discipline of writing a short thesis each day is underrated. It turns monitoring into learning, and over a few weeks it shows which signals you tend to overweight or ignore.
Where Geopolitics Meets Infrastructure
Physical assets do not exist in a political vacuum. Sanctions change which tankers can call at which ports. Conflict raises insurance costs on specific routes. Export restrictions on equipment or materials slow maintenance and expansion. Infrastructure risk and geopolitical risk are, in many cases, the same risk seen from two angles.
That is why it helps to read infrastructure data alongside a broader platform for geopolitical risk monitoring, where conflict, economy, supply chain, cyber, energy and climate signals are scored in one place. When a geopolitical event touches a corridor you already watch, you can judge its physical impact immediately instead of waiting for commentary.
We covered the platform-selection side of this question in an earlier piece on choosing a market intelligence platform, and the portfolio side in a walkthrough of turning geopolitical risk analysis into portfolio decisions. For a view on why news timing matters so much in energy, see this note on oil and gas coverage that arrives too late to trade on.
Common Mistakes to Avoid
- Treating every outage as bullish. Many outages are planned, short or offset by spare capacity elsewhere. Context decides impact.
- Ignoring the downstream chain. A crude disruption may matter less than the product shortage it causes two weeks later.
- Confusing simulation with observation. Scenario outputs are assumptions. Keep them labelled and separate.
- Watching too much. A focused list of high-impact assets beats a crowded map nobody can read.
The Bottom Line
Energy infrastructure is where supply risk becomes real. Analysts who watch pipelines, terminals, processing hubs and grids directly will usually see stress building before it appears in price. The edge does not come from having more data, but from seeing the right assets together, separating facts from scenarios and building a routine that tests judgement every day.
If you would like to discuss how GeoMoney's infrastructure and energy tools could fit your research workflow, you can contact the GeoMoney Intelligence Platform team directly.


Comments
Post a Comment